
We would like to start this article with two jaw-dropping, head-scratching statistics:
Leadpages found out that 49% of small business owners aren’t sure if their marketing efforts are effective.
At the same time, statistical data from Brightlocal show that SMBs spend on average 46% of their marketing budget on digital marketing.
What do these numbers tell us? Well, for once this means that Small and Medium Businesses invest a high amount of money in advertising. But, at the same time, only half of them check their results to find out if they are making revenue with their investement.
49% of small business owners aren’t sure if their marketing efforts are effective.
SMBs spend on average 46% of their marketing budget on digital marketing.
SMBs have a lot on their plate
As astonishing as these facts are, we totally understand their situation. SMBs have a lot of things on their plate, being responsible for running a business and making sure nothing major gets dropped. And if you don’t have a big marketing team, tracking results can be time-consuming and complicated.
Here is a solution. We will show you the 6 most relevant metrics you should focus on. They will tell you if you are investing your marketing budget efficiently and what you should do to grow your business more successfully.
And the best thing is you can find all of this information in your analytics tool.
Here are the six most important KPIs you should track to grow your business.
KPI #1
Conversion Rate and Average Order Value
The first thing you obviously want to know is how much money you are making with your website. You can find this out by using the combination of Conversion Rate and Average Order Value.
Why both? Your Conversion Rate shows you if you are reaching your goals. This does not necessarily have to be revenue. For non-eCommerce websites, your goals could be to gather newsletter sign ups or leads. Your Conversion Rate does not indicate how much money you are making. This is where the Average Order Value comes in. This metric will make it clear, how much money these converted users actually leave on your website.
Example:
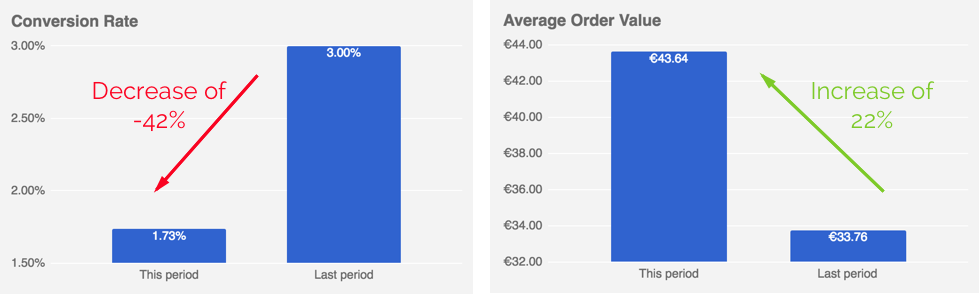
This image is a perfect example of how important it is to analyze both Conversion Rate and Average Order Value.
Even though the Conversion Rate decreased by 42%, the Average Order Value grew by 22%.
So, you can easily tell your CEO or investors that there is no need to be stressed out as business is growing (even though you should also work on increasing your conversion rate, of course.)
Great read: Avinash Kaushik tells you on his blog post why obsessing about Conversion Rate is not the right way to go.
KPI #2
Traffic per Channels
Next, you will want to find out how people are reaching your website. Are they coming from your Facebook Ads or Google AdWords? Or do they find you through Google Search?
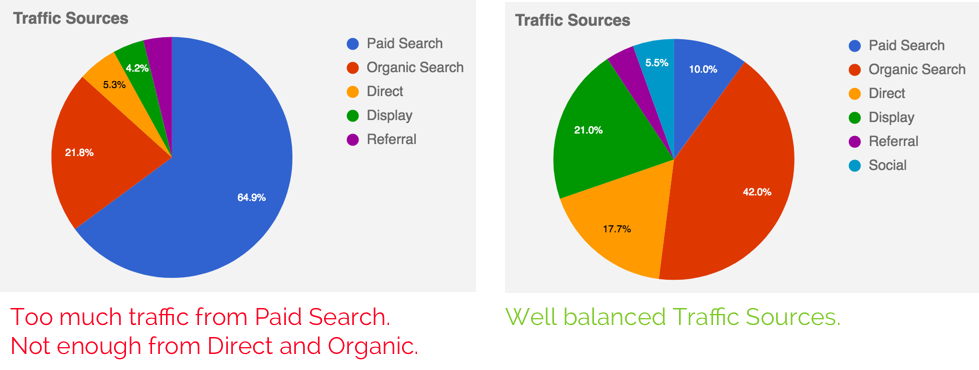
It is crucial for you to have a balanced acquisition strategy. A good rule of thumb is to get 40% to 50% traffic from Search – otherwise, you would risk being overexposed to any Google algorithm changes. 20% Direct Traffic and 20% to 30% Referring Sites are a good proportion. And around 10% should come from Campaigns.
Example:
The first diagram shows a website which gets most of the traffic from Paid Search. This can be a costly way to go, but if you just started your business, it is ok to get a lot of traffic from paid channels. It is still crucial to even this out and to invest more work in SEO and thus reach users through organic search traffic. If your traffic from direct search is underrepresented (like in this example), we recommend working on your branding.
KPI #3
Revenue (AOV) per Source/Medium
If you are spending money on advertising, this KPI should become one of your closest friends. Revenue per Source/Medium shows you how your campaigns are performing and if you are investing your marketing budget on the right channels.
Remember when we were talking about the great couple Conversion Rate and the Average Order? You will use these two metrics here as well to understand how many people converted for your goal(s) and how much revenue you got out of it.
Example:
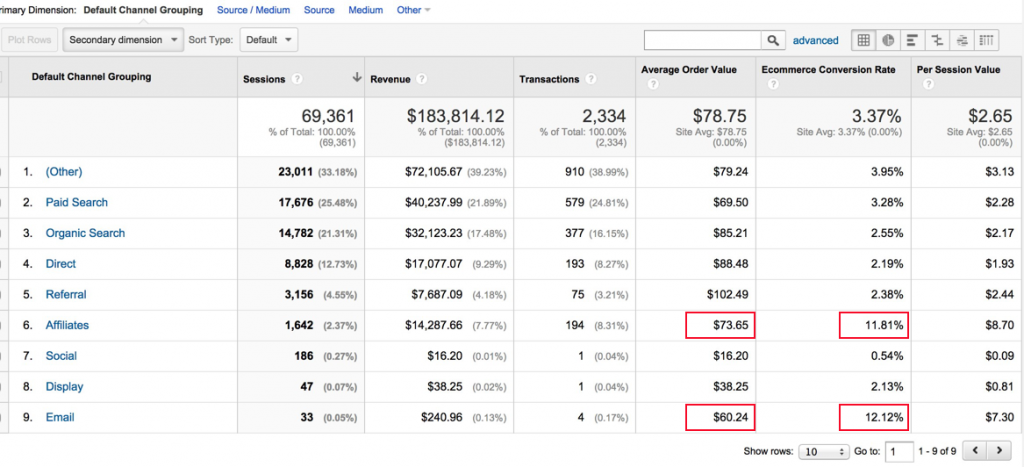
Imagine you would only track the Conversion Rate per Channel, what would your analysis say about these numbers? Probably, your email Marketing is the most valuable Channel, right?
But, once you also have a look at the Average Order Value, you quickly realize that your Newsletter Subscribers do not purchase a lot on your website.
So, instead of concentrating purely on this channel, you should take your Affiliate Program into account. This is the most promising channel as the conversion rate is high and your users also tend to purchase for a lot more money!
KPI #4
Sales Funnel
We may state the obvious here, but let us say it anyhow: The final steps in your sales funnel are the most crucial ones.
You put so much energy into reaching your target groups, guiding them through your website and now you have to make sure they are taking the final step. This could be to persuade them to purchase on your shop or to sign up for your newsletter. Without this last step, you are simply not successful.
This is why you have to pay extra attention to track these last steps and to find out why people are leaving.
Example:
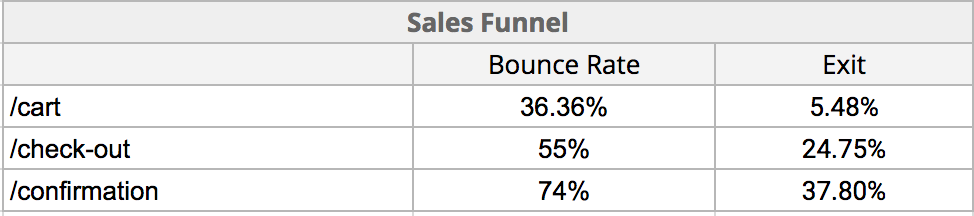
We are looking at a three-step check-out process here. The first step performs quite well. A lot of users proceed to the next step.
Step two and three need optimization as the bounce- and exit-rate are very high. We highly recommed to find out why users are leaving the page. It could be because the check-out progress has a technical issue or it is simply too complicated.
Additional Reading: Crayzegg provides more tips on how to optimize your sales funnel.
KPI #5
Page + Landing Page Review
Everybody who has ever launched and maintained a website knows how much work it is to put up great content to reach customers. Reviewing your Pages will help you to find out which pages are visited by your clients and where you are not getting enough attention.
Have a closer look at the winners and find out what you are doing well. You can use this information to optimize the rest of your pages.
Landing Pages are the pages where your customers enter your site. The advantage of this KPIs is that you can also analyze the Average Order Value to find out which Pages perform the best as conversion magnets.
Example:
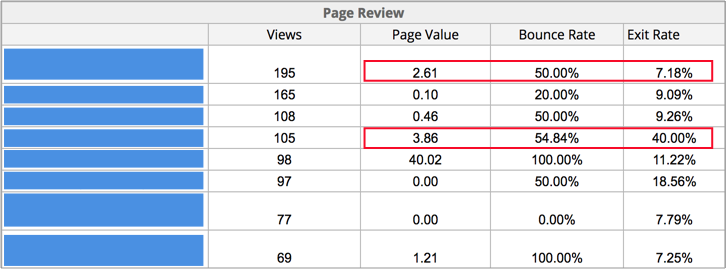
Looking at the Page Review, the number one page performs alright. The Bounce Rate is quite high. Try to optimize the page to guide the users to the next step.
The fourth page has the best potential. The Page Value is fantastic but why do so many users still leave the page? This should get reviewed in depth.
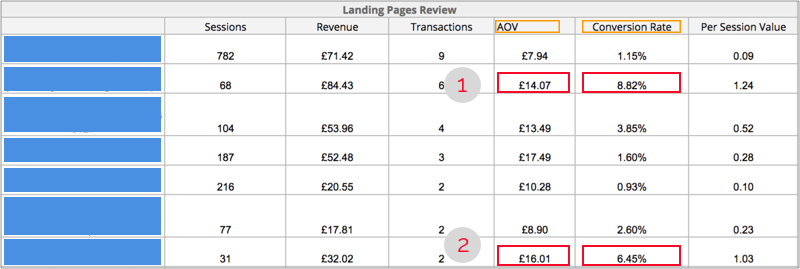
From a Landing Page perspective, the page we marked with “1” has the best conversion rate. But again the Average Order Value shows that users don’t purchase enough.
The opposite is the case for the landing page with the number “2”. High Conversion Rate AND the Average Order Value promises a page which could work as a conversion magnet.
KPI #6
Keywords Review
SEO and Keywords are essential for any business success. Your target groups have to find your website through their Search Queries.
This KPI tells you which keywords your users are using to reach your site. You should check if these keywords actually match with your SEO strategy. It is important to analyze the Bounce Rate and Conversion Rate for your keywords. They indicate if your users really find what they were looking for on your website or if they quickly leave your page.
Example:
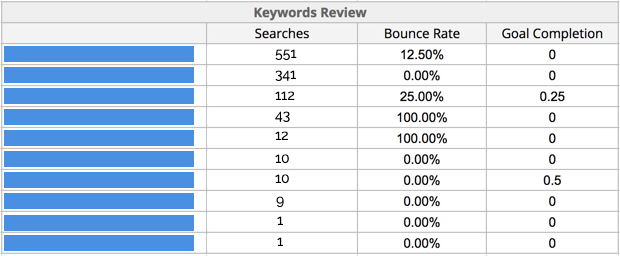
The keyword review clearly shows that the used keywords for this page do not convert leads into clients. This can be an indicator that the website does not provide the promised information or the landing pages do not provide value for completing the goals.
One of the most important information is hidden behind the blue bar. Are these keywords the one you are targeting or does your SEO strategy lead to a different picture?
Voilà!
This is it. If you check these KPIs regularly, you will quickly find out how successful you are using your marketing budget. It may take some practice at first, but it will save you money and also make you more successful.
Get your free review here
We are offering you a fantastic opportunity to get your website reviewed for free. And you will get great advice on how you can use your marketing budget more efficiently to grow your business.